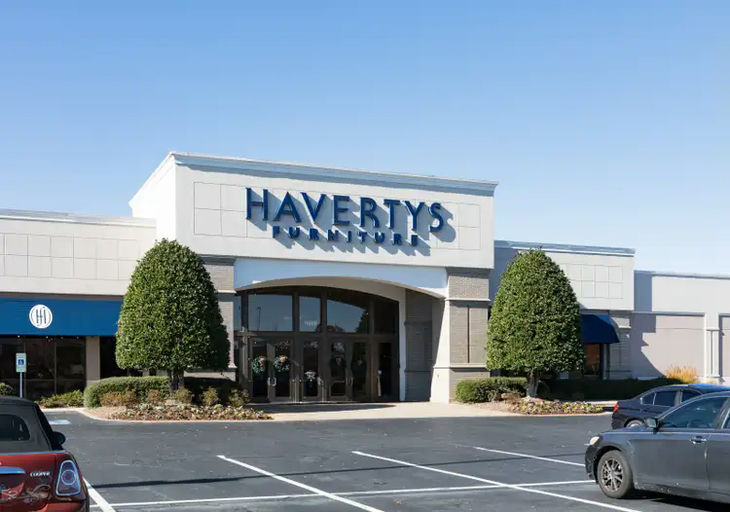
Haverty Furniture HVT
Haverty Furniture is an American retailer of home furniture and accessories, targeting educated, middle- to upper-income women living in suburban areas.
- Ticker
- HVT
- Headquarters
- Atlanta, Georgia
- CEO
- Steven Burdette
- IPO year
- 1980
- Sector
- Furniture Retailer
- Website
- havertys.com
- Management
- Team & leadership ↗
Notes & Takes
"A boring furniture store business that’s always been quietly profitable. Founded in 1885 in Atlanta and went public in 1929, talk about staying power. Over the past decade, about 65% of cash flow has been returned to shareholders through buybacks and dividends."
Company Financials
Quarterly Headlines
Full financial detail for each company lives in its Google Sheet, linked above. Best viewed on desktop.
Haverty Furniture Q1 2026
Mar 31, 2026
- Diluted EPS of $0.26
- Sales up 4.1%
- Comp sales up 4.3%
- Gross profit margin was 61.5%
- Our design program continues to be a key growth driver
- Designer average tickets are more than double the average ticket
- Designer sales are 35% of the total revenue
- New stores in Dallas, Atlanta and Fredericksburg
- Cash of $114 million with no debt
- Repurchased 91,000 shares for $2 million
- Paid $5.3 million in cash dividends
- Capital expenditures for 2026 estimated to be $34 million
Haverty Furniture Q4 2025
Dec 31, 2025
- Diluted EPS of $0.51
- Sales increased 9.5% to $201 million
- Comparable sales increased 8.5%
- Gross profit margin of 60.4%
- We are planning 5 new stores for 2026 and entering Pittsburgh PA
- Designed consultants accounting for 33% of total revenue in 2025
- Cash of $131 million with no debt
- Guiding for $33.5 million in capital expenditures for 2026
- Total pre tax income of $26.8 million for 2025
- Operating cash flow of $52 million with capital expenditures of $20 million for 2025
Haverty Furniture Q3 2025
Sep 30, 2025
- Diluted EPS of $0.28
- Sales up 10.6% to $194 million
- Comp sales up 7.1%
- Gross profit margin of 60.3%
- Strong labor day weekend performance, first quarter of positive comp store sales in several years
- Our recent opening of a third Houston location brings our total store count to 129. We expect to resume store count growth in 2026, targeting 5 new store openings for the year
- Design consultants accounted for 34% of written business in 2025 to date
- Cash of $137 million with no debt
- $45.3 million in cash from operations YTD
- Paid out $15.5 mill in dividends YTD
- Planned capital expenditures for the full year are estimated to be $24 million
Haverty Furniture Q2 2025
Jul 30, 2025
- Diluted EPS of $0.16 versus $0.27 YoY
- Sales up 1.3% with comp sales down 2.3%
- Gross profit margin of 60.8% flat YoY
- Design consultants accounted for 33.4% of written business in 2025
- Cash of $113 million with no debt
- Invested $11.7 million in capex the first 6 months
- Paid $10.4 million in quarterly cash dividends the first 6 months
- Purchased $2 million worth of shares outstanding the first 6 months
- Planned capex for the full year is $24 million
- Our average ticket decreased slightly but remained strong at just under $3,400, while designer average ticket continued to grow at 5% to over $7,600
- In Vietman, there are concerns about potential labor shortages and wage challenges resulting from increased production demands.
- We continue our push to open 5 new stores a year
- Rents have not gone down for new store openings
- At year end we will have 129 stores
Haverty Furniture Q1 2025
Mar 31, 2025
- Diluted EPS of $0.23 vs. $0.14 YoY
- Sales down 1.3% to $181 million
- Comp sales down 4.8%
- Gross profit margin was $61.2% vs. 60.3%
- We have a weak housing market, winter weather in the South, low consumer confidence and big shifts in trade policy
- Design consultants accounted for 33% of written business in 2025
- Cash of $118 million and no debt
- Invested $6.1 million in capex
- Purchased $2 million worth of stock
- We are guiding for 60% gross profit margins for the year and $24 million in total capex
Haverty Furniture Q4 2024
Dec 31, 2024
- Sales decreased 12.5% YoY with comp sales decreasing 13.7%
- Gross profit margin of 61.9%
- Cash of $126 million with no debt and credit availability of $80 million
- Expect gross profit margins to be 60% for 2025
- Expect capex spend of $27 million for 2025
- Repurchased $5 million in 2024 and paid out $20.5 million in dividends
- Spent $32 million in capex for 2024
- Diluted EPS of $1.19 for 2024 vs. $3.36 in 2023
- Pre tax income of $26.2 mill in 2024 vs. $75 mill in 2023
Haverty Furniture Q3 2024
Sep 30, 2024
- Total sales were down 20% vs. Q3 2023
- Comparable store sales decreased 20.5% vs. Q3 2023
- We will be ending 2024 with 129 locations
- The consumer remains cautious on making big ticket purchases and lack of housing turnover has dampened demand.
- Gross profit was 60.2% vs. 60.8% QoQ
- Cash was $127 million in September 2024
- No debt outstanding and credit availability of $80 million
- Planned capital expenditures of $33 million for 2024
- We had no significant damage to any of our locations from the recent hurricanes
Haverty Furniture Q2 2024
Jun 30, 2024
- Our growth strategy is on track with plans to open a net of five new stores in 2024 and 2025
- Haverty’s strong financial position enables us to make important investments during demand downturns as others retrench.
- Gross profit was 60.4% compared to 60.5% QoQ
- Total sales down 13.4% QoQ with comp sales down 13.6% as well QoQ
- Cash and restricted cash at $116 million in June 2024
- Generated $17.5 million in cash from operating activities the first 6 months of 2024
- Invested $16 million in capital expenditures
- Planned capital expenditures for the full year of 2024 are $33 million
- No debt outstanding and $80 million available on line of credit
Haverty Furniture Q1 2024
Mar 31, 2024
- Our sales reflect the challenges from the ongoing weak housing market.
- Total sales down 18.1% QoQ with comp sales down 18.5% QoQ
- Gross profit increased 60.3% from 59.1% QoQ
- Cash and restricted cash balance was $117 million as of March 2024
- Generated $3.1 million in cash from operating activities the first 3 months
- Invested $6.4 million in capital expenditures
- Paid $4.8 million in quarterly cash dividends
- No debt outstanding and credit availability of $80 million
- Planned capital expenditures of $32 million for the full year